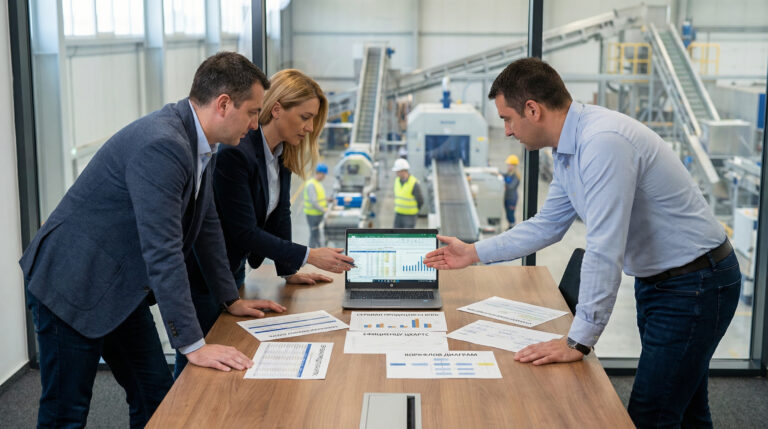
Real-time data visualization and analytics. A clear performance overview enables faster, more informed decision-making.
We deliver seamless omnichannel ERP integration for unified operations and data-driven decisions. In the future, we’ll focus on AI-driven demand forecasting and personalized customer experiences, including dynamic pricing and promotions.
Seamless ERP and MES integration connects production, resources, and data, delivering real-time insights and operational efficiency. Looking ahead, we’ll leverage AI and IoT for predictive maintenance, demand forecasting, and intelligent automation.
With ERP-driven transformation across inventory, sales channels, and operations, we enable data-driven inventory and omnichannel management. E-commerce and value-added services elevate customer experience, while AI and predictive analytics will power the future.
We provide ERP solutions for other industries, ensuring regulatory compliance and tailoring them to each business operation. AI will drive automation of processes, while Dynamics 365’s will offer flexible, tailored module adoption.
ERP systems like Business Central are built for recording and reviewing transactions, whereas Microsoft Power BI is built for understanding patterns and making decisions. While ERP reports are essential for daily operations, they are often static and provide a limited view.
The real difference in practice:
The greatest value lies in the synergy between the two: using the ERP as your single source of truth and Power BI as your engine of intelligence.
Real-time insights transform your data from a history book into a GPS for your business. Instead of reacting to the past, you are actively steering the present.
Why real-time insights matter:
How Power BI delivers that "Right Now" view:
The most valuable reports are those that turn "hidden" ERP data into immediate action. Management uses Power BI to unify data from the ERP and other systems into a single, interactive view.
The most common and high-impact analyses include:
Power BI centralizes these diverse data streams into one visual hub. It moves management away from "gathering data" and toward "taking action," ensuring every decision is backed by a complete, 360-degree view of the enterprise.

Koristimo kolačiće da bismo poboljšali vaše iskustvo pregledanja, pružili personalizovane oglase ili sadržaje i analizirali naš saobraćaj. Ako kliknete na dugme „Slažem se”, prihvatate našu upotrebu kolačića.
Prilagodite željene postavke:
Neophodni kolačići su obavezni da bi se omogućile osnovne funkcije ovog sajta, kao što su obezbeđivanje bezbednog prijavljivanja ili prilagođavanje željenih postavki saglasnosti. Ovi kolačići ne skladište nijedan podatak sa ličnim informacijama.
These cookies are needed for adding comments on this website.
Google Tag Manager simplifies the management of marketing tags on your website without code changes.
These cookies are used for managing login functionality on this website.
WPForms is a user-friendly WordPress plugin for creating custom forms with drag-and-drop functionality.
Analitički kolačići se koriste da bi se razumelo na koji način posetioci ostvaruju interakciju sa web-sajtom.
Google Analytics is a powerful tool that tracks and analyzes website traffic for informed marketing decisions.
Service URL: policies.google.com (opens in a new window)
Kolačići za oglašavanje se koriste da bi se posetiocima obezbedili prilagođeni oglasi na osnovu stranica koje su prethodno posetili i da bi se analizirala efikasnost kampanja oglašavanja.
Facebook Pixel is a web analytics service that tracks and reports website traffic.
Service URL: www.facebook.com (opens in a new window)
Pronađite više informacija:Terms of Use and Privacy Policy.